
Have you ever faced a product problem so messy it felt impossible to solve? Do you jump to solutions, only to realise later you didn’t fully understand the problem? I see many product people struggle with this. I did too. But then I started approaching discovery more systematically.
After graduating, I joined a Big 4 consultancy firm. While still finding my feet and wobbling on my training wheels, I learned a simple framework to break down complex problems into manageable chunks. This was over 5 years ago, and it’s since become the foundation of how I not only solve problems but also approach business and product strategy.
The framework? McKinsey’s Problem-Solving Framework (that’s right, we’re bringing out the big guns for this.)
The basic outline of the framework is
- Clarify the problem and objectives
- Structure and prioritise key drivers
- Analyse data, generate insights, and plan solutions
Let’s apply it to the Work Product: Streaming Personalisation that I wrote up in the previous blog post. Note: I’ll be using FigJam to map this out. If you haven’t tried it yet, I highly recommend FigJam as your virtual whiteboard. It’s great for virtual team collaborations; I use it all the time over an actual whiteboard. In dating terms, the physical whiteboard has been dumped and is now eating ice cream on the couch whileFigJam walks the red carpet with me.
Step 1: Define the Problem
We start by defining the problem. Looking at the Work Product, it might look like this:
- Users find it hard to decide what to watch due to an overwhelming library and generic recommendations
- Users report suffering from “stream fatigue”
After this, we want to set the objective and scope for the project. This step is critical because it ensures we not only have a clear understanding of the problem but also a defined vision of what what success looks like.
We might map out something like this in FigJam:
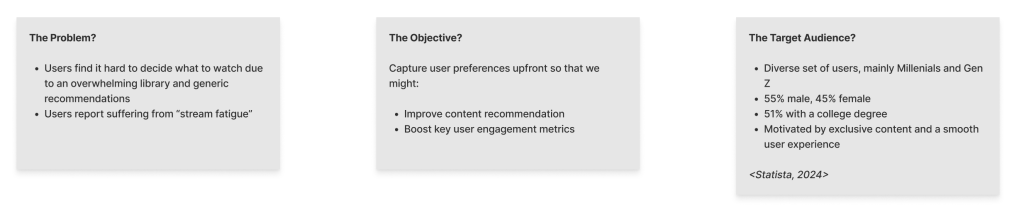
Here, we’ve defined the objective quite broadly. We want to improve content recommendation to boost key user engagement metrics. This includes the time users spend browsing, lowering the number of clicks needed to choose a title, and, in the long-run, increasing the percentage of users who continue to subscribe to the platform (aka retention rate). An important thing to mention here is that we want to keep the objective somewhat high-level at this stage. After all, the worst mistake in product development is jumping to a solution before you’ve fully broken down the problem!
The target audience serves as a key reminder of who our primary focus group is. Ideally, this would be replaced with more detailed insights, like specific personas or behavioural groups.
Step 2: Disaggregate the Problem
To better understand the problem, we’ll disaggregate it using the “MECE” rule (Mutually Exclusive, Collectively Exhaustive). Note: When I first started out, I thought “MECE” was just a strategy consultant’s trick to sound smart in front of clients, but it’s actually a simple heuristic to ensure we cover everything without overlap.
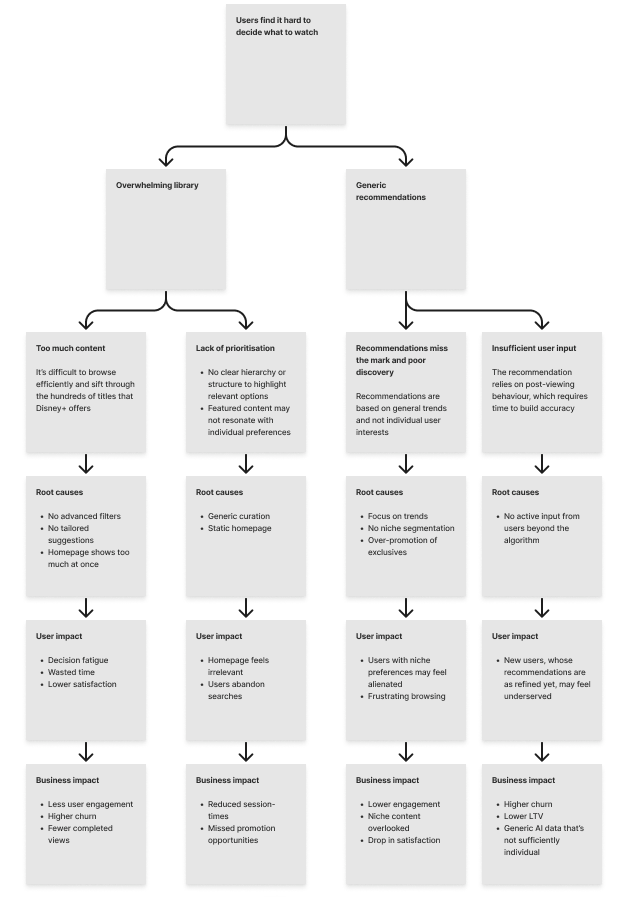
This analysis explores why Disney+ users may struggle to pick what to watch, focusing on two key issues: an overwhelming library and generic recommendations. Equally, it disaggregates these two issues and examines the root causes like a lack of filters, generic curation, and minimal user input. These factors may lead to user frustration, wasted time, and decision fatigue, which ultimately impact important business metrics like higher churn and lower engagement. All in all, breaking the problem down this way helps identify clear opportunities to improve the experience.
Ideally, this should be backed up by real customer insights. Remember, as I mentioned in the Work Product, talking to a few friends and family members does not substitute actual user research!
Step 3: Create Hypotheses
Now that we’ve disaggregated the problem, we can shift to the ideation stage. How might we solve the issues we’ve identified?
The next step is to create hypotheses that connect a possible solution (something we’ll do) to an expected product outcome (something we’ll achieve), grounded in an insight or assumption. Yes, for this example, most of the stuff are assumptions from my side.
Here are some sample hypotheses from the problem disaggregation:
- H1: We believe letting users pick favourite genres and characters will improve recommendations because it provides preference data
- H2: We believe immediate recommendations following a user’s pick of favourite genres and characters will improve relevance and satisfaction because they personalise content from the start
- H3: We believe adding filters for moods and interest will reduce browsing time because it helps narrow choices
- H4: We believe tailoring the homepage to users’ habits will boost engagement because it better reflects user behaviour
We’re going to run with H1 for this exercise. But how can we know it actually addresses a customer need?
Step 4: Collect Data
Existing Insights
We know some users feel overwhelmed by too much content and generic recommendations. Informal talks with friends and families indicate that people often give up scrolling or waste time training the algorithm. All streaming services use some degree of personalisation to tackle this, which reinforces the idea that Disney+ could do the same. However, we don’t have data yet on how letting user manually pick their favourite genres and characters (H1) affect engagement or long term-term satisfaction.
Admittedly, there are some gaps in our understanding.
Data Gaps (and How to Fill Them…)
- Engagement: Does selecting favourite genres and characters upfront reduce browsing effort? Do customers even want to invest in the time required for this?
We can start with a survey to gather feedback from users. Work with a user researcher to explore pains users face with Disney+ content and recommendations. Try to discover If users like the idea of picking favourite genres and characters and if they think it would improve recommendations. If the survey shows interest, follow up with in-depth user interviews. In these, ask users about their expectations, how they’d use the feature, and what they’d see as a good experience. Ultimately, this process helps decide if the idea (H1) is worth pursuing. It’s important here that you stay honest and objective. When talking to users, don’t lead users to your desired answer; it has to come naturally. A good user researcher will help you retain your objectivity.
- Recommendation: Are the current recommendations from Disney+ effective?
To evaluate how well Disney+ recommends content to users, we can track key metrics like clicks on suggested content, skip rates, and how long users stay engaged. Another useful metric is whether recommendations encourage users to explore a variety of content.
The data can come from platform analytics (you know, your usual things like clicks, skips, and views), A/B testing different recommendation methods, and simple surveys asking users if suggestions feel relevant. This will highlight how effective the recommendations are and where they can improve.
If I know my Disney, they likely have a team of data scientists already working on this. Start with their insights. There is no need to reinvent the wheel when existing data might already provide valuable answers.
- Churn: Why do users stop using Disney+?
To understand why users stop using Disney+, we can track how many days they go inactive before cancelling. Exit surveys can capture direct reasons for leaving, like poor recommendations, pricing issues, or technical problems.
Equally, regular surveys or ratings can flag dissatisfaction early. This data will uncover key churn drivers and point to areas for improvement.
Step 5: Analyse and Test
With the data in hand, we now analyse the findings and test our hypothesis. For H1, review survey and interview data to confirm if users want to select preferences and believe it improves recommendations. Put the survey and interview results against the backdrop of available quantitative data on recommendation and churn. What does the data say? Is it a problem worth solving?
If it is, build a high-fidelity prototype to simulate the flow where users pick genres and characters. Test it in a controlled environment, measuring things like completion rates (recall that the goal was >80%) and collecting user feedback on relevance and satisfaction. Compare the prototype against default suggestions, tracking engagement metrics like clicks to find a title and session duration.
Since it won’t be the user’s natural environment – I mean, who wouldn’t enjoy getting paid to sit on their couch and browse Disney+ at home? – the findings may have some limitations.
Step 6: Develop Solutions
The goal is to design a preference selection flow that addresses the identified problems while aligning with the product outcome, which is to improve content recommendation and boost user engagement metrics.
We’ll revisit the results from the analyse and test phase to evaluate desirability, viability, and feasibility.
- Desirability checks if users find the flow useful and easy to use. Usability tests and metrics like completion rates and relevance scores will provide clarity here
- Viability ensures alignment with business goals, such as increasing recurring subscribers and reducing churn. It should also support long-term growth and adapt to future needs
- Feasibility examines technical constraints. Ensure that the solution works with existing recommendation systems and metadata structures without overloading engineering or creating future maintenance burdens
There are plenty of ways to balance these criteria. In a future blog post, I’ll share how I’ve used a numeric formula in Python to weigh them in practice (once I come up with a cool name for it!).
Step 7: Plan Implementation
I’m a big fan of the Now-Next-Later roadmap. It’s especially awesome when dealing with many unknowns. Unlike traditional roadmaps with rigid timelines and development work planned out months in advance, is that it leaves room for some flexibility as things evolve. Given I don’t work for Disney and have no insight into their backlog, this approach is particularly useful here.
Example of what the Roadmap might look like for us:
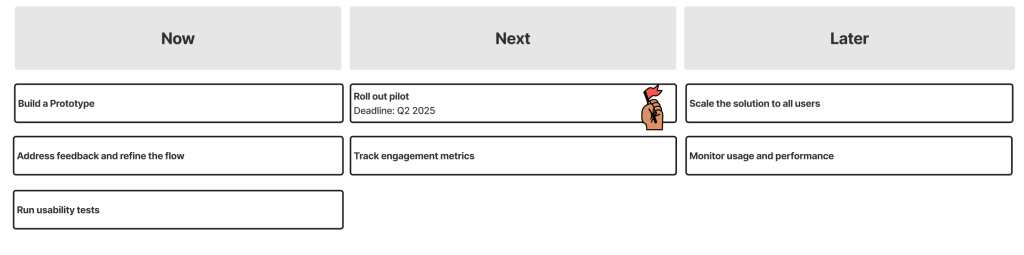
- Now: Build a prototype and run usability tests to measure completion rates (>80%) and user satisfaction. Address feedback and refine the flow.
- Next: Roll out a pilot version to a small group of users, track engagement metrics like relevance (>75%) and clicks to find a title (<5), and fix any issues
- Later: Scale the solution for all users, monitor usage and performance, and optimise based on long-term metrics like retention and churn
This is a simple take on the Now-Next-Later roadmap, which works for this exercise. If you’re interesting in learning more, I highly recommend Janna Bastow’s interview on Lenny’s Podcast. It’s called “Building better product roadmaps”, and it’s a great listen (Link to podcast).
As a side note, I’ve found some limitations with the Now-Next-Later roadmap. In my experience, the biggest challenge is managing with stakeholders who want clear timeframes. Investors, naturally, are humans too and need something concrete to pin their hopes on. That said, this is something I might dive into in a future blog post.
Step 8: Communicate Insights
Getting buy-in is perhaps the trickiest part. What I found effective is telling a story everyone can understand. I’ve recently used Figma Slides to share product ideas, and they work brilliantly. Unlike your typical slide decks, you can embed actual prototypes which allows you to show clear visualisations of the idea you’re trying to sell. You should, of course, and also showcase supporting data and demonstrate why the initial hypothesis (H1) will be successful.
When talking to the C-suite, focus on metrics like reducing churn and boosting engagement. For design and engineering teams, talk about how the flow works, the risks, and how they will be handled. Ideally, this shouldn’t happen too late. It’s always a good idea to involve the design and engineering teams early in the process, even during the problem disaggregation phase.
Importantly, the aim here is to get everyone on board with the plan.
Step 9: Monitor and Iterate
Once the feature is in production, the focus is on tracking performance and optimising it. The product metrics outlined in the Work Product can serve as a foundation, and we’ll monitor these through dashboards.
Equally, user surveys and feedback can help highlight where adjustments are needed.
This cycle of monitoring and iterating ensures the flow stays relevant to users, meets business goals, and adapts to changing needs over time.
Final Words
The final FigJam might look something like this:
And that’s it. A practical way to use McKinsey’s Problem-Solving Framework to tackle product challenges. From breaking down problems to testing and refining solutions, this approach, or at least some elements of it, has helped me to bring clarity to otherwise complex issues.
Whether it’s defining product outcomes, testing ideas, or sharing your vision (again, shoutout to Figma Slides!), the aim is to build something valuable for users and the business.

Leave a comment